 MyMap
MyMape.g. Autosomal recessive trait passing through three generations — grandparents, parents, and two affected children
genogram
01
List people and relationships
Use stable identifiers and explicit parent-child pairs for every generation.
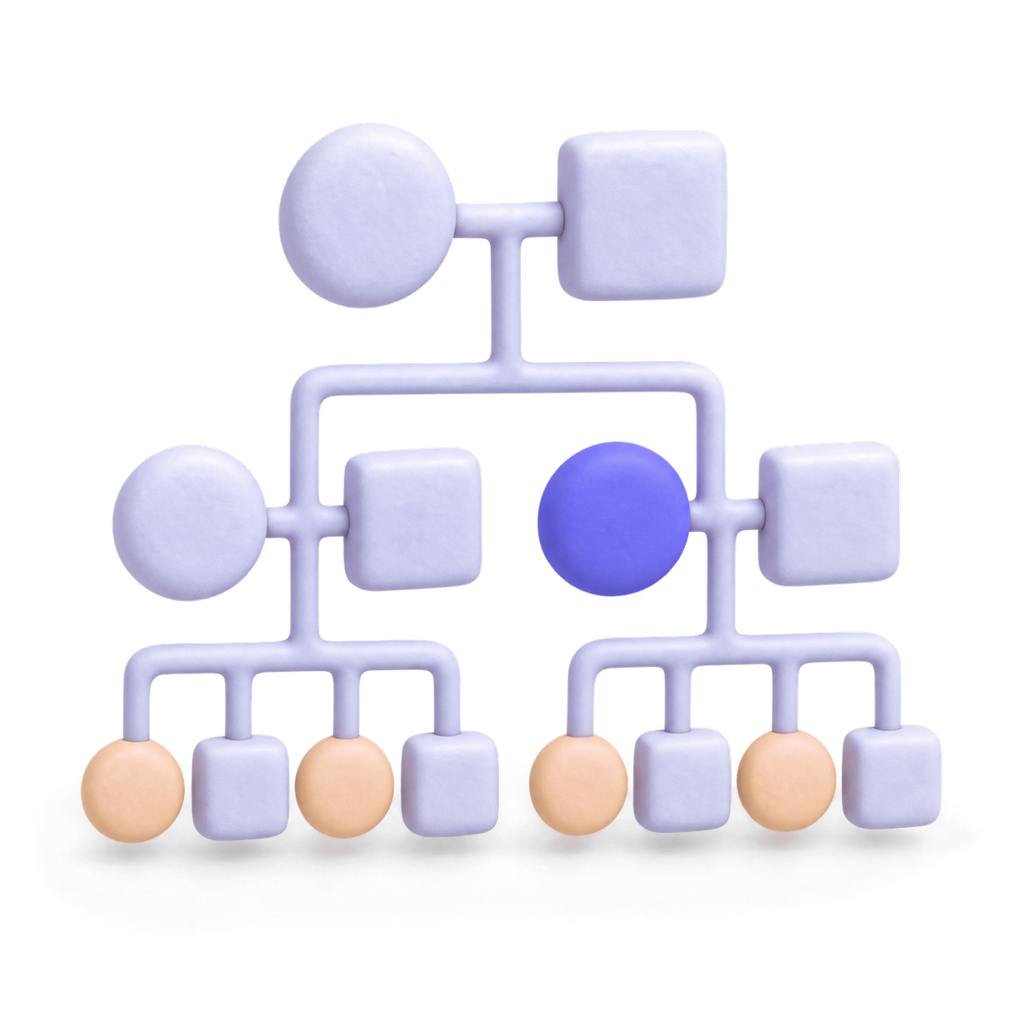

Describe a trait, disorder, or inheritance scenario and AI draws a standard genetics pedigree chart with generations, affected individuals, and carrier symbols.
Ask a follow-up…
Click one to fill the box above. Edit anything before you send.
No template to fill in and no drawing. You talk; the canvas keeps up.
e.g. Autosomal recessive trait passing through three generations — grandparents, parents, and two affected children
Use stable identifiers and explicit parent-child pairs for every generation.
State the known status of each person and include the legend required by your course.
Check each connection and symbol against the scenario before interpreting any pattern.
A genetics pedigree combines family relationships with a defined notation for a particular trait. The chart must distinguish what the scenario actually states from what a learner is asked to infer.
A pedigree can make a multi-generation word problem easier to inspect. Build the family structure first, add supplied trait information second, and keep interpretation separate from the recorded observations.
MyMap can draft the family structure and requested labels from your description, then revise them through conversation. This page has no fixed example. Check the output against your course's notation rather than assuming every generated symbol is standard.
Whole map or one frame. PDF and clean PNG on Pro.
Ask for slides from this map and present frame by frame.
A read-only link for anyone; they can copy it to their own canvas.
Every map stays on your canvas; come back and ask for more.
A diagram can help organize a classroom problem, but its layout alone does not establish a pattern. Keep any interpretation separate and check it against the exercise's evidence.
Mark it explicitly as unknown using the legend you specify. Do not let the absence of information imply an unaffected or carrier status.
Use the tool to organize an educational scenario. A generated pedigree does not establish diagnoses, carrier status, or individual medical risk.
Create PERT charts in seconds. Describe your project and AI generates a network diagram — with tasks, dependencies, time estimates, and critical path analysis, ready to refine and share.
Create T-charts in seconds. Describe what you want to compare and AI generates a clear two-column T-chart — organize pros and cons, similarities and differences, or any two-sided analysis, ready to refine and share.
Turn any breakdown into a pie chart in seconds. Describe your data or categories and AI generates a clean, labeled pie chart — proportions calculated and visualized automatically.
Organize an event or passage into Who, What, When, Where, and Why, with unknowns kept visible.
Draft an AARRR funnel with defined lifecycle events, supplied metrics, and questions about where users stop progressing.
Generate a flowchart draft from a process idea. Give AI the intended outcome and constraints, then review proposed steps, decisions, and exceptions.
Draft a classroom anchor chart around one lesson. Organize key terms, a short explanation, and worked examples at the reading level you specify.
Create an area chart from time-series values to show changing magnitude. Specify units, dates, and whether series overlap or form parts of a total.
Free to start. No credit card required.
✦ Free to start · No credit card required · PDF, docs & images supported